
The Efficiency Race Is Entering a New Phase
From 2019 to 2023, PERC technology dominated solar manufacturing. In recent years, however, the landscape has evolved significantly. As of early 2026, TOPCon accounts for a substantial share of global production, while PERC capacity continues to decline — according to CRU market analysts.
As adoption increases, the focus is shifting from whether TOPCon will scale to how different TOPCon implementations perform in real-world conditions. For developers and EPCs, the key metric is not just nameplate wattage, but sustained energy yield over 25–30 years and long-term LCOE performance.
This article explores the structural principles behind TOPCon technology and examines how different design approaches influence long-term energy generation.
The Core Innovation: Tunnel Oxide Passivated Contact
Why Recombination Matters
Solar efficiency’s fundamental enemy is electron recombination. When sunlight frees electrons in the silicon wafer, they must reach the metal contacts to generate current. At unpassivated surfaces, electrons recombine with holes before escaping — losing current and voltage.
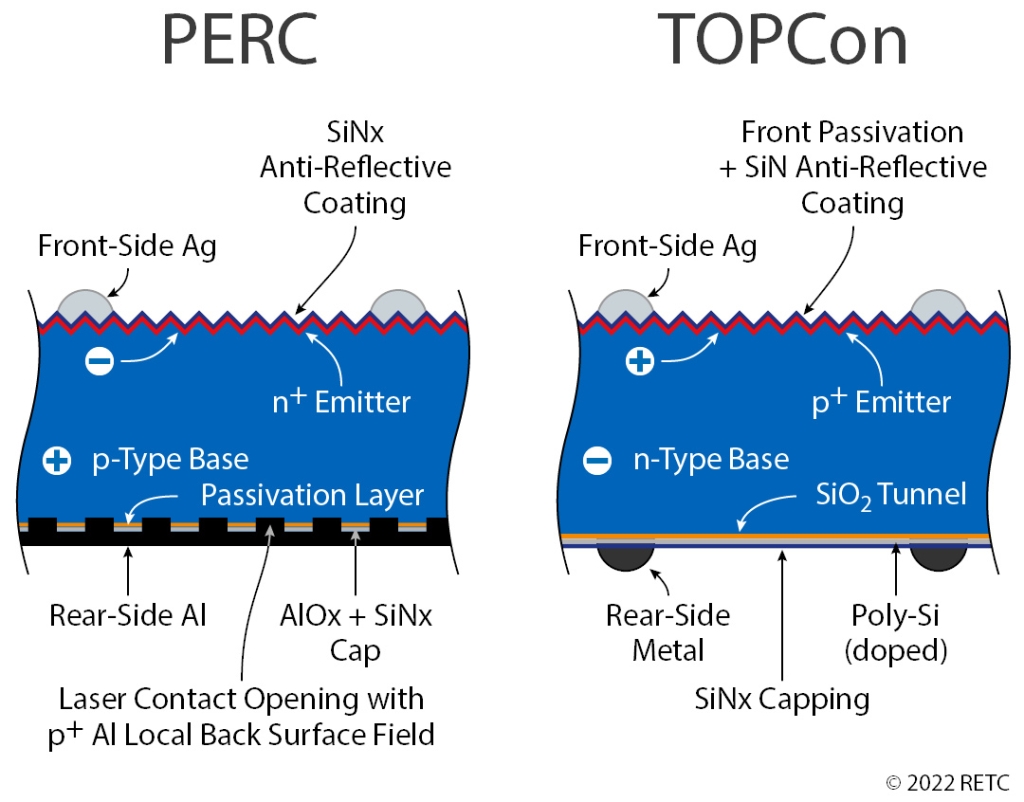
The industry measures this via Surface Recombination Velocity (SRV): the lower the number, the better. PERC adds a dielectric rear passivation layer beneath the aluminium, but the localized back contacts required for current extraction create current crowding and inherent recombination losses.
TOPCon’s Solution
TOPCon (Tunnel Oxide Passivated Contact) restructures the cell with two critical rear layers:
- Ultra-thin SiO₂ tunnel layer (1–2 nm) formed via thermal oxidation/PECVD + LPCVD poly-Si (Low-Pressure Chemical Vapor Deposition)
- Heavily doped n⁺ poly-Si (polycrystalline silicon) layer
Crucially, there is no direct metal-to-silicon contact. Electrons pass through the oxide via quantum tunnelling, creating a powerful dual passivation effect:
- Chemical passivation: SiO₂ physically saturates dangling bonds at the silicon surface
- Field-effect passivation: the n⁺ poly-Si layer repels minority carriers from the surface
Result: SRV drops to <10 cm/s (vs PERC's 100+ cm/s), boosting open-circuit voltage (Voc) by +10–15 mV. This enables a higher Fill Factor (FF), resulting in higher conversion efficiency.
Why n-type Substrate Changes Everything
The p-type Problem: Boron-Oxygen Defects
P-type PERC panels carry an inherent material flaw. P-type wafers are doped with boron; when exposed to sunlight, boron reacts with residual oxygen to form Boron-Oxygen (B-O) pairs. This causes Light-Induced Degradation (LID), immediately consuming 1–3% of initial power. Over 2–5 years, Light and Elevated Temperature Induced Degradation (LeTID) can strip a further 2–5%.
n-type Advantage: Inherent Stability
n-type substrates replace boron with phosphorus — B-O formation is chemically impossible. The result: near-zero LID from day one. n-type silicon also delivers higher minority carrier lifetime, improving low-irradiance performance during dawn, dusk, and overcast conditions. Astronergy adds further protection through anti-LID processes, strict oxygen content control during crystal growth, and hydrogen passivation.
Degradation: The Numbers That Matter
| Metric | Standard PERC | Standard TOPCon | Astronergy ASTRO N7 Pro |
| First-year degradation | ~2.0% | ≤1.0% | ≤1.0% |
| Annual degradation (Year 2–30) | ≤0.50–0.70% | ≤0.40–0.55% | ≤0.35% |
| 30-year remaining power | ~80–85% | ~84–85% | ≥88.85% |
*Remaining power calculated as: (1-first year degradation) × (1-annual degradation)^(years-1)
This is a 6%+ cumulative power advantage by Year 30 — accelerating project payback from 8–9 years to 6–7 years.
Third-Party Validation and Field Performance
The performance of modern PV modules is not only defined by design, but also by independent validation and real-world operating data.
Astronergy’s modules have undergone established certification processes, including IEC 61215 for design qualification and IEC 61730 for safety compliance, as well as UL 61730 for North American markets.
In addition, third-party testing and benchmarking programs such as Kiwa PVEL and RETC have consistently evaluated module performance under stress conditions. Across multiple testing cycles and field monitoring projects, key indicators such as degradation rates and performance ratios have demonstrated stable behavior across different climates.
These results help provide a more comprehensive view of long-term module reliability beyond laboratory conditions.
Performance Comparison: The Numbers That Matter
| Metric | Standard PERC | Standard TOPCon | Astronergy ASTRO N7 Pro |
| Mass production efficiency | 22.8–23.5% | 24.0–24.5% | 24.8% |
| Temperature coefficient (Pmax) | −0.35 to −0.40%/°C | −0.28 to −0.30%/°C | −0.26%/°C |
| Bifaciality factor | ~70% | 80–85% | 85±5% |
| Power output (66-cell, 210R) | 540–560W | 580–620W | 650–670W |
Better Temperature Performance
At a typical summer cell temperature of 60°C (ΔT=35°C vs STC 25°C), a standard PERC module loses ~12.3–14.0% of its STC-rated power (based on −0.35 to −0.40%/°C). With its ultra-low −0.26%/°C temperature coefficient, the N7 Pro loses ~9.1% — a net advantage of ~3.2%+ more power during peak irradiance hours.
Maximising Bifacial Gain
N7 Pro’s thinner gridlines and dense current collection network, combined with the enhanced rear-side light absorption and conversion efficiency enabled by PF technology, together deliver a bifaciality of 85 ±5%.
The high bifaciality of the N7 Pro can bring a power gain of 1%-3% across varying ground reflectance conditions.
Silver Consumption: A Solved Problem
Early TOPCon iterations required 20–30% more silver paste than PERC. Astronergy’s ZBB technology has closed this gap — significantly reducing silver usage compared to 2023 TOPCon models.
Manufacturing Excellence: TOPCon 5.0+ Platform
While the physics of TOPCon are universally understood, mastering mass production demands precision at every step:
- Proprietary Tunnel oxide formation & LPCVD poly-Si deposition: <0.2 nm thickness uniformity across 182mm and 210mm wafers
- Optimised poly-Si deposition: minimal mechanical stress, flawless electrical conductivity
- 100% in-line PL (photoluminescence) and EL (electroluminescence) inspection
30-Year Outlook: Why the Degradation Curve Wins Projects
By Year 10, TOPCon retains 2–3% more power than PERC. By Year 20, the gap grows to 4–5%. By Year 30, TOPCon panels can produce up to 6–8% more power than conventional p-type predecessors, depending on climate and operating conditions.
Financial Impact
For a standard 100 MW utility project with a 25-year PPA at $40/MWh:
- 4–6% additional lifetime energy yield
- ~$12–18 Million NPV revenue increase
*Assuming 6% discount rate, 85% capacity factor
- LCOE reduction: $1.20–00/MWh (3–5% relative)
*Equivalent to ~3–5% relative reduction at $40/MWh baseline
- IRR improvement: +0.3–0.5 p.
Astronergy’s Bankable 30-Year Warranty
- Year 1: ≥99% remaining power (≤1% degradation)
- Years 2–30: ≤0.35%/year linear degradation
- Year 30: ≥88.85% remaining power
Backed by BloombergNEF Tier 1 bankability status, extensive field data from earlier n-type deployments, robust financial reserves, and a transparent performance monitoring portal for asset owners.
TOPCon: The Mainstream Standard Today and for Years to Come
TOPCon modules have crossed the 24% efficiency threshold in mass production. The race is no longer about proving the concept — it is about optimization at scale: temperature coefficients, degradation curves, bifaciality, and manufacturing consistency. With PERC’s era now closed, TOPCon has become the industry standard for the next phase, and Astronergy is already building what comes next.
The efficiency race isn’t just about peak watts. It’s about watts that last.